Business platform Analytics
Run your fleet on data
Utilisation KPIs, occupancy rates, process flows and predictive maintenance. The ultimate plan for analysing your fleet's patterns and managing assets with data.
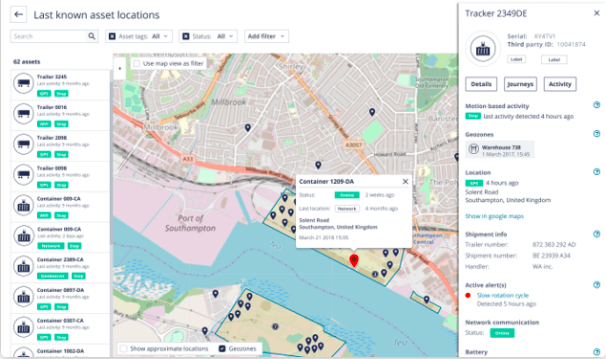
Utilisation KPIs —
run your fleet on data
Supply chain managers have no visibility into how long their assets are actually used. The result: an unoptimised fleet size and maintenance on a fixed calendar rather than on real usage. The Analytics plan answers this with three types of utilisation KPI, calculated in real time.
How many hours an asset has been used over a defined period. Identify under-used and over-used assets to optimise the size of your fleet.
How many times an asset is used over a period (e.g. 8 deliveries last week). Define your own utilisation KPIs, matched to your process.
Has an asset been used at least once during the period? Track the occupancy rate and catch fleet fluctuations in real time.
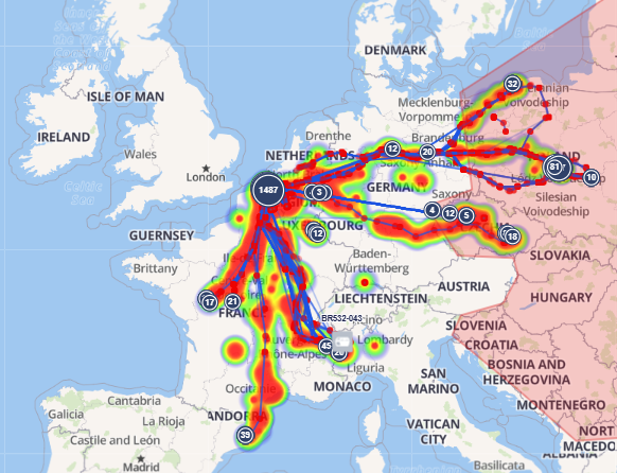
Model your
business processes
Model your process flows in the platform and follow each step in real time. The orientation service detects the exact state of an asset (open/closed, empty/full) or a key event (a skip being emptied) with no manual intervention.
Model your business processes (loading, transport, delivery, return) and follow each asset step by step on the platform.
Monitor the orientation of an asset in a stable state (box closed/open, container flat/upright). Full history with a state timeline per asset.
Detect a rapid change of orientation (a skip being emptied, unloading). The event is captured as it happens, even if brief.
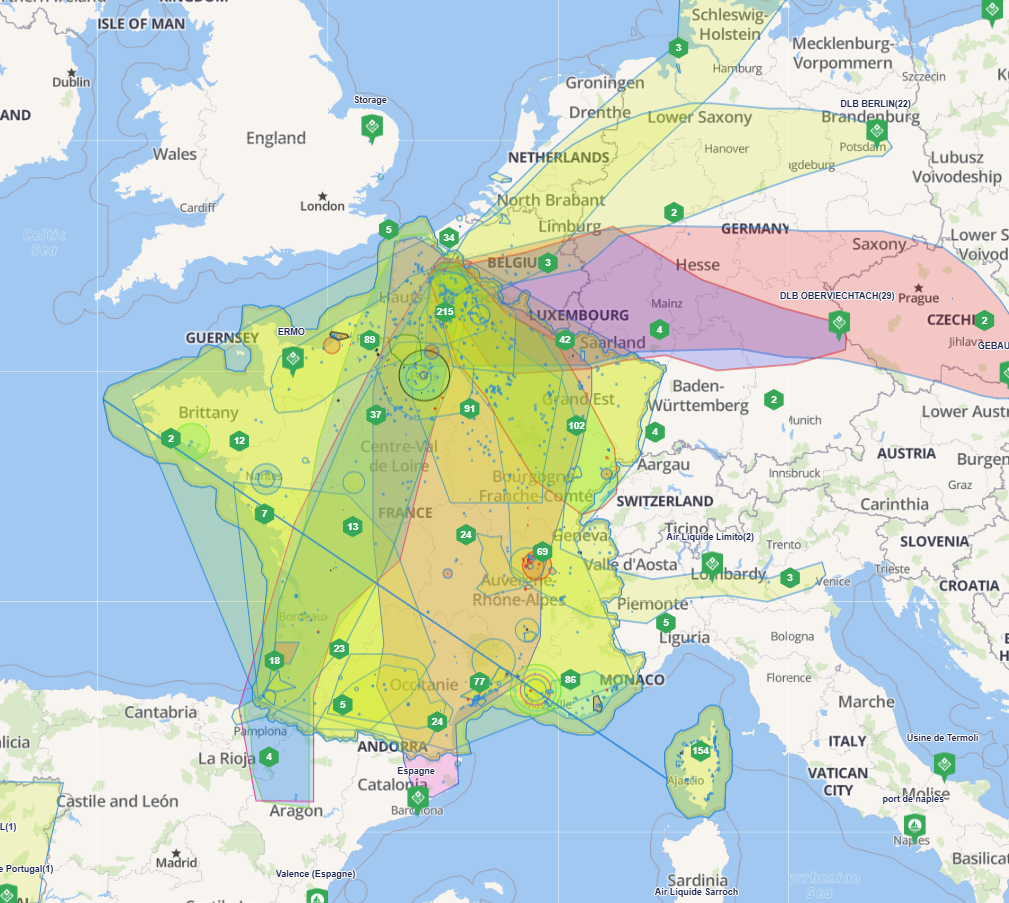
Complete dashboards —
embedded Power BI & iFrame
The Analytics plan unlocks every dashboard widget — including the process, maintenance and process evolution widgets — and lets you embed your Power BI dashboards, or any external BI tool, directly inside the TRAKmy platform.
Analytics-exclusive widgets: maintenance program status, process, process evolution, process step. See the state of your processes and your maintenance programme in real time.
Build your dashboards in Microsoft Power BI or any external BI tool (Grafana, Tableau and others) and embed them directly in the TRAKmy platform through an iFrame.
36-month data retention. Custom scheduled reports, Excel/CSV exports with bespoke layouts, and reports generated externally through REST and pushed into the platform.
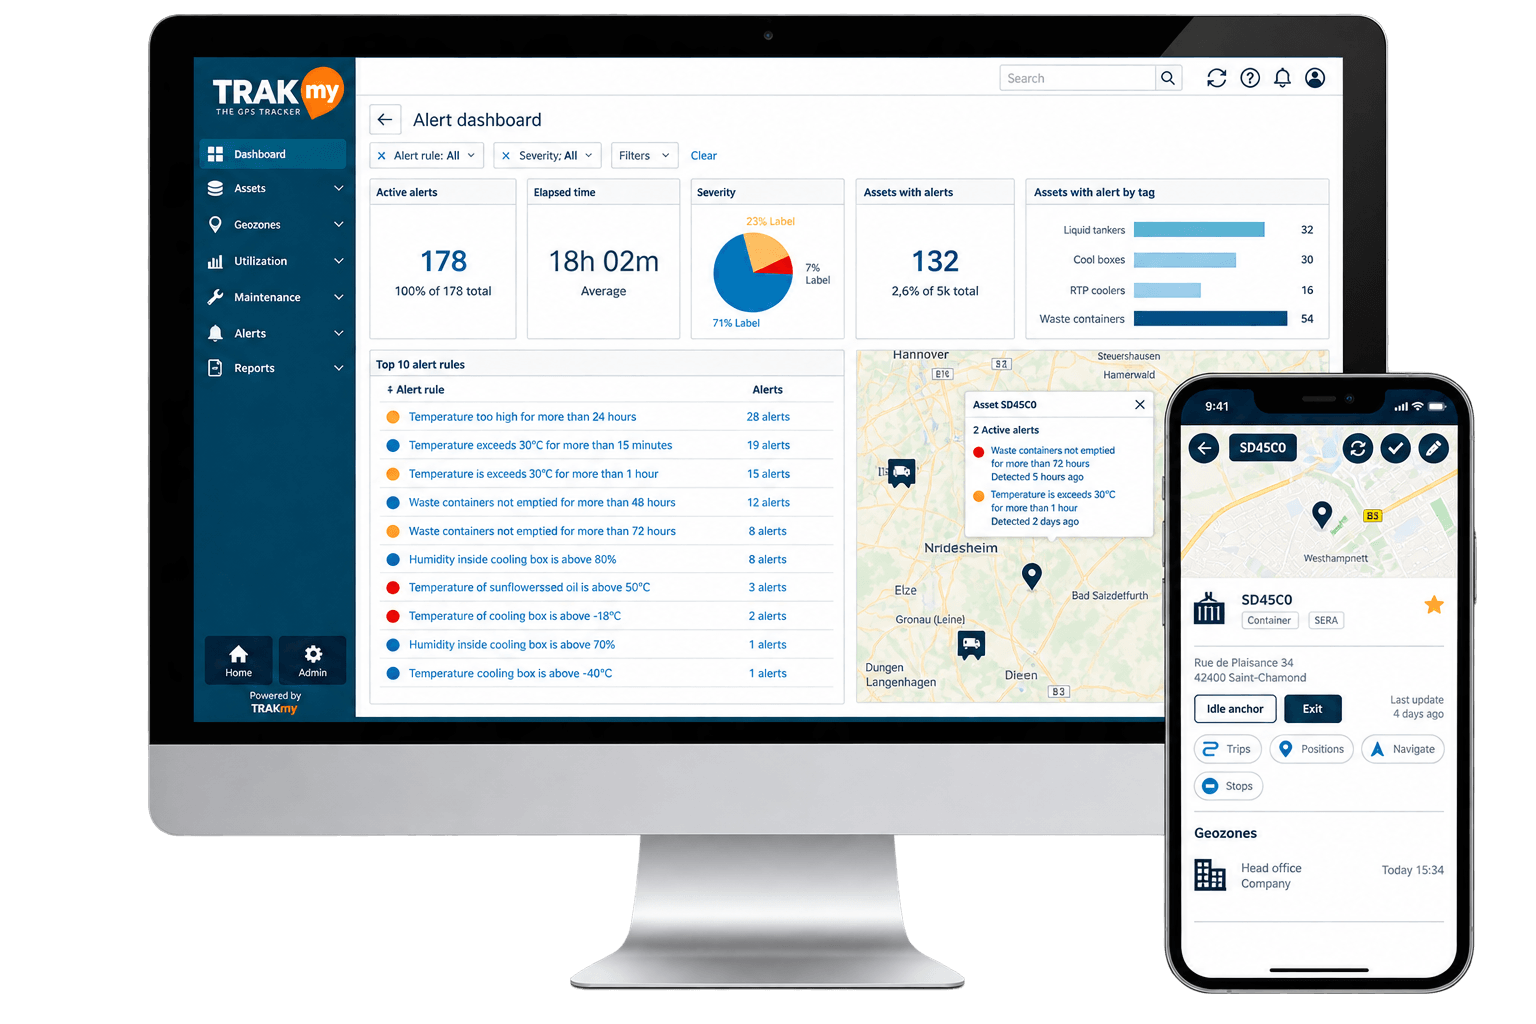
50 alert rules —
wizard + every data source
The Analytics plan covers every alert source: geofences, BLE sensors, utilisation, orientation and process flows. Active dashboard plus full history. Notifications by email, REST push or MQTT.
50 alert rules included in the Analytics plan · 200 geofences · 36 months retention
Web platform, mobile app
& enterprise-ready API
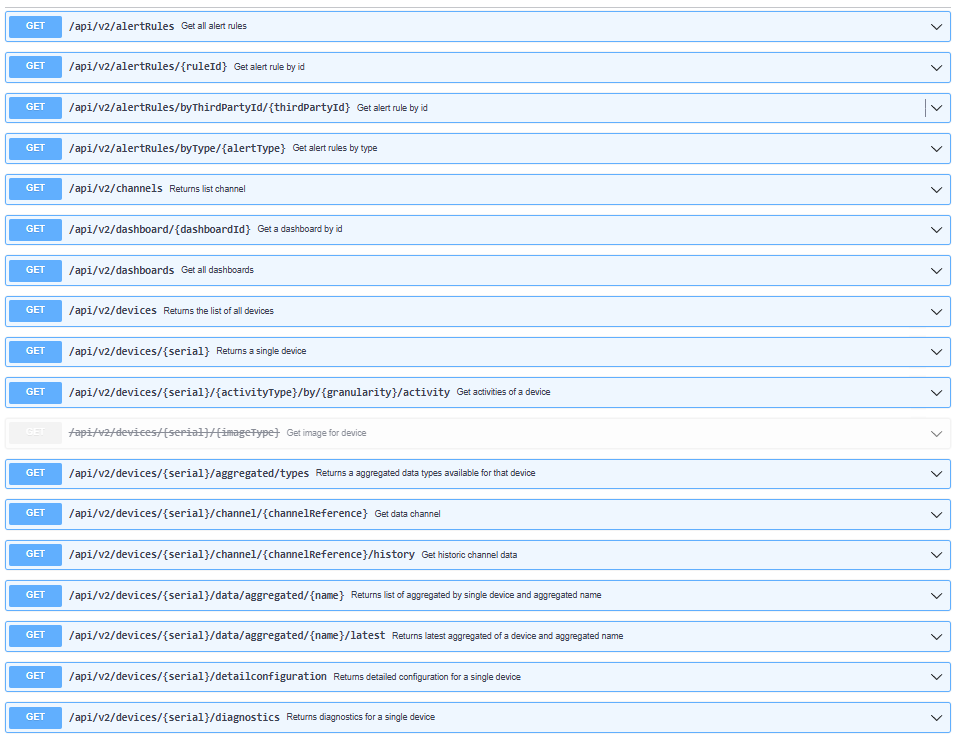
Full access from any device. The Analytics API covers Pull (time series, aggregated data, KPIs, alerts), Push (REST or MQTT webhooks) and administrative actions. OpenAPI 3.0 documentation, Swagger and a Postman collection.
Map, journeys, BLE sensors, ERP business data, KPI access, guidance to an asset and field updates.
Pull JSON: time series, aggregated data, KPIs, alerts. Push: REST or MQTT webhooks to SAP, Microsoft Dynamics, Power BI or any third-party tool. Swagger and Postman included.
Inject your ERP data into each asset, define your own utilisation KPIs and model your process flows directly from the platform.
Who uses the Analytics plan ?
Demanding fleets that want to manage their assets with KPIs, process flows and bespoke dashboards.
Manage your occupancy rates, follow your manufacturing processes step by step and optimise fleet size with real-time utilisation KPIs.
See the offerModel your logistics flows (loading → transport → delivery → return) and follow every container, pallet or asset at each step of the process.
See the use caseTrack the utilisation rate of your skips, detect emptying through orientation events and optimise your rounds using real fill-level data.
See the use caseSchedule machinery maintenance on real operating hours rather than a fixed calendar. Cut unnecessary maintenance costs.
See the use caseObjectively measure the occupancy rate of your rented fleet, justify renewals and produce automatic utilisation reports for your customers.
See the use caseBring your TRAKmy data into your existing Power BI dashboards. See stillage rotations, transport cycles and operational KPIs in one place.
See the use caseChoose your GPS tracker
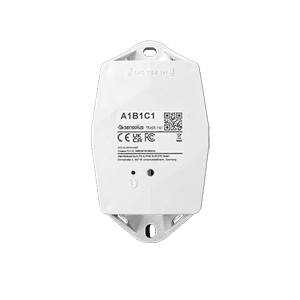
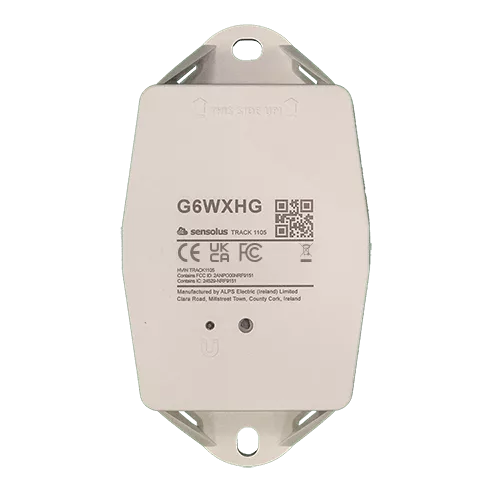
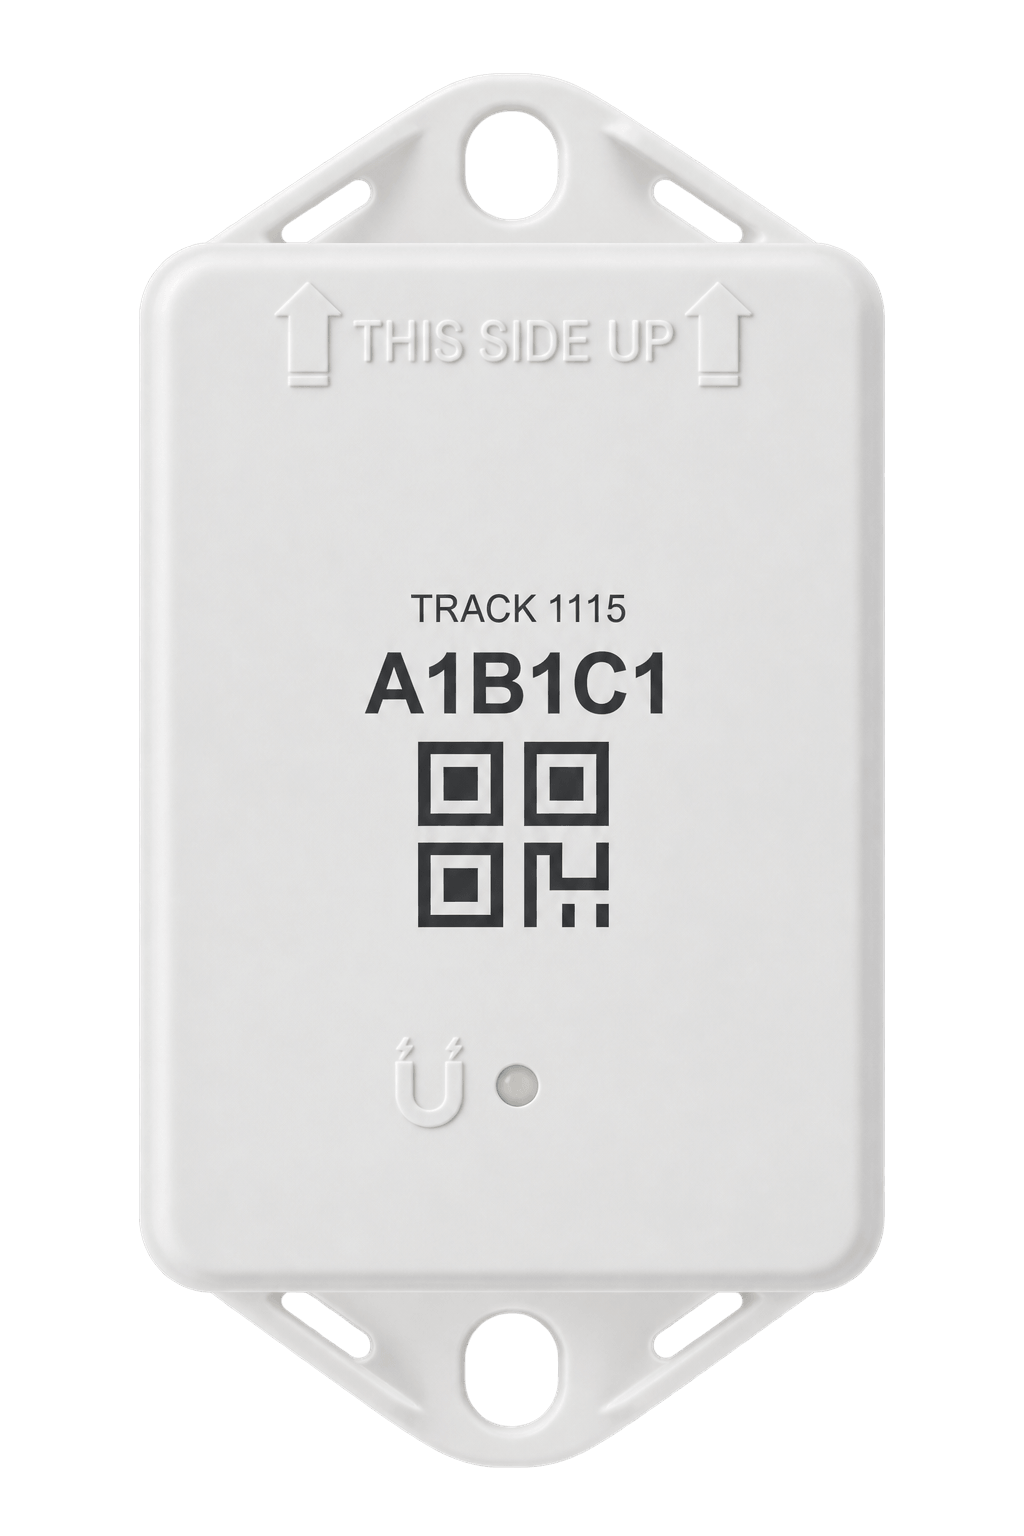
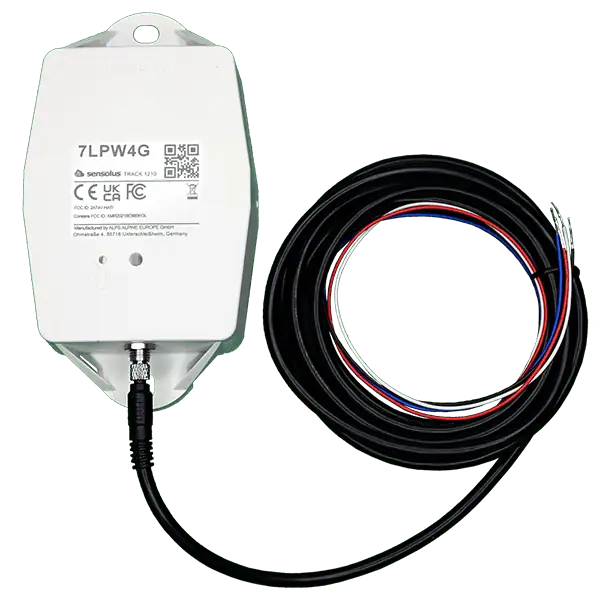
The Analytics plan works with the whole TRAKmy range. The ULTRA N+, ULTRA N and COMPACT trackers support BLE sensors for condition monitoring and the orientation service.
Essential, Professional
or Analytics ?
Every plan includes the web platform, the mobile app and the API. Move up a plan with no interruption, whenever you need to.
Everything you need to know
about the Analytics plan
TRAKmy use cases
The Analytics plan for
running B2B fleets on KPIs
Construction
Construction fleets & sites
Utilisation KPIs per machine, preventive maintenance programme, Power BI for managing multi-site projects.
Skips
Skip & container management
Geofence statistics — flows between sorting sites, stock evolution in centres, container dwell times.
Logistics
Logistics & cold chain
Process Flow Service — model your logistics pipelines, fleet KPIs, native BI integration.
Rental
Equipment rental companies
Utilisation KPIs per asset (usage rate, average duration), Maintenance Service for the fleet, mileage estimation.
Local government
Councils & municipal fleets
Power BI dashboards for technical services, municipal fleet maintenance, KPIs for road and green space teams.
Landscaping
Landscaping & green spaces
Utilisation KPIs for petrol tools, maintenance programmes, journey playback for optimising rounds.
Flat glass
Flat glass & glazing
Process Flow for stillages: production → dispatch → delivery → return. Stock evolution at customer sites.
Transport
Road transport & fleets
Fleet KPIs, mileage estimation, multi-fleet Power BI dashboards, preventive vehicle maintenance.
Article
Professional asset tracking
Understand the stakes and benefits of tracking professional equipment: ROI, operational gains, theft prevention.
See the Analytics
plan in 30 minutes
A TRAKmy expert will walk you through the platform using your own use case — KPIs, process flows and dashboards. No commitment.